Cryptodash
Created by Logan Krumbhaar
Hi, welcome to my app. This is a project I built in around two months in order to learn and improve my web development skills. The front-end uses React/NextJS, and the back-end uses Node, ExpressJS, and PostgreSQL. For styling, I used SASS adhering to the BEM methodology. I'm using CoinGecko's API to query cryptocurrency price data. Once I have the data, I plot it on a graph rendered with SVG. To manage the state of the app, I opted for MobX for its ease of use.
The main course of the app is the overview page. Creating this page involved fetching data, managing and processing the data fetched, and then rendering the data to SVGs and informational tables.
I fetch data from CoinGecko's API on the serverside and then serve it to the client. I'm using the free API, which only gets 50 requests per minute, so I had to make sure to be efficient with how many API calls I make. I decided to create a caching system to significantly lower how many requests I'd have to make. When the user queries for a coin's graph data, I first check the cache to see if we have any valid data up to date within 30 minutes. If so, it is valid and served to the user. I also have a script running on the server every 30 minutes to keep the cache up to date with at least all the default coins. This enables me to serve most users all the required graph data bundled in first request, rather than loading the overview page, then fetching my server (12 requests for the 12 default coins), which then either fetches from CoinGecko or uses cached data. Another optimization I was able to make here to significantly lower requests made, was to update the yearly and monthly (longer time interval) caches at the same time as updating my daily price data cache. Normally, these would each require an additional API call, but since I make a request every 30 minutes 24/7, I can create my own yearly and monthly caches from the data I gather every day.
Next, I have to process and send that data to my app's state managed by MobX. MobX will automatically update my components when any new data is received, but optimizations had to be made here as well. I fetch monthly and yearly data in the background after all daily and weekly data (essential for initial page render) is loaded. I maintain stores for each time frame so they may be observed by a component and have it only update if new data for that time frame is received. If you don't do this, you will end up re-rendering all graphs 20+ times unnecessarily (12 coins times 2 monthly/yearly data) when new data is received.
Finally, I rendered the data using SVGs. I spent a lot of time tweaking how the graph looked and behaved. I wanted it to be both visually appealing, as well as representative of what you might see in a fully functional financial dashboard application. There is standard line plot mode which shows a given coin's price graph superimposed onto your total portfolio balance graph. The second tab of the graph shows a Japanese candlestick chart for a given coin. Something I found quite interesting when viewing all the coin graphs visually next to each other was just how similarly their prices fluctuated in unison. I guess this is because the cryptocurrency market is for the most part viewed as a homogeneous mass, with consumer interest in all coins tracking more or less simultaneously.
For the analyze page, I had to experiment with a few different Python libraries to get decent looking price prediction results. I also had to consider that it would be running on a low resource server, and needed to create price forecasts within a short amount of time on not so powerful hardware. First I tried FB's prophet library, which was fast, but the graphs it outputted didn't look very convincing. Next, I tried an LSTM (Long Short Term Memory) neural network, and at first glance the prediction seemed quite accurate, but upon closer inspection did not provide an adequate result. The neural net cheated by just copy pasting the last day onto the end of the graph, resulting in a realistic looking, but oddly symmetrical forecast: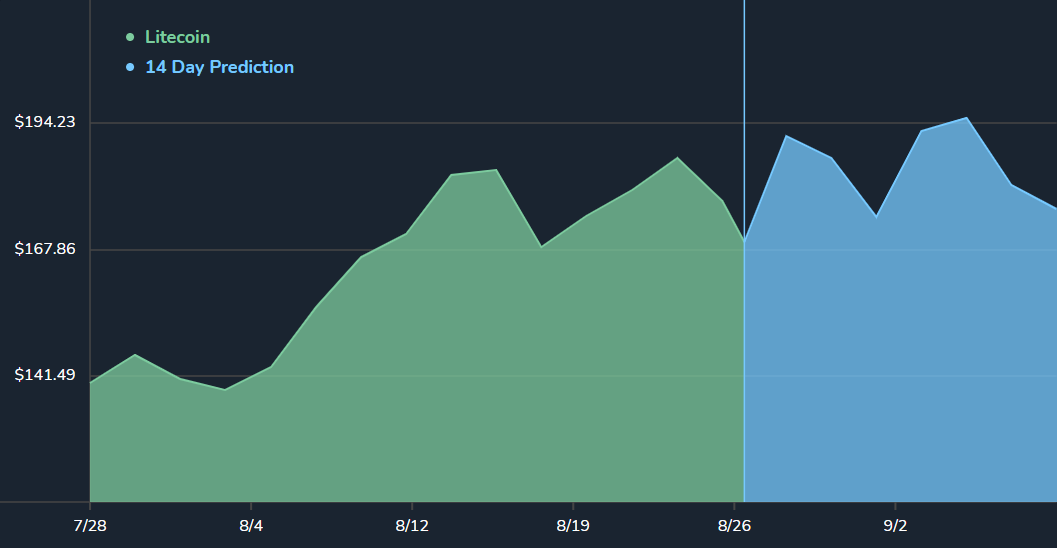
The prediction system I settled on uses a lightweight neural network that analyzes recent price patterns and volatility. The neural network learns from recent price movements to detect trends, while a stochastic model adds realistic volatility based on the coin's actual price behavior. This hybrid approach produces predictions that look natural and match the characteristics of real market data.
For a basic price prediction system that's mostly for show/novelty, I'm satisfied with the results.
The rest of the app consisted of creating basic login functionality, a few more fun features I didn't mention here, and filler pages to fit with the theme of a demo finance dashboard. Overall I think it was a good experience and taught me a lot about NextJS, React, and the latest technologies in use in the web development space. Thanks for checking out Cryptodash! You can contact me and view the rest of my portfolio here.